


Election Year and Its Effects on Compensation
Every January, NFPCC purposes to focus on major events that will shape the compensation landscape in the new year. In 2020, the biggest factor that will impact the future of compensation packages and organizational success/profitability, that is a certainty, is the 2020 presidential election this November. As NFPCC has attended many board meetings over the fourth quarter of 2019 and into the early stages of January, many boards are already beginning to look ahead to late 2020 and into 2021 as part of their strategic planning processes.
Specifically, many boards, regardless of which side of the isle they reside politically, believe there is heavy uncertainty based on the potential outcomes of the election. Based on this constant theme of concern over the election, NFPCC has reviewed the past twenty years’ worth of elections and their resulting impact on the United States economy to identify if these concerns are substantiated and if so, to what degree.
NFPCC focused on the S&P 500 as the basis for comparison. This basis for comparison has become an emerging trend across all industry sectors as it can illustrate, on a directional basis, what an investor could have expected to receive with their investment dollars in the general marketplace. The following chart provides context of the S&P 500’s total shareholder return (“TSR”) leading up to an election, during an election year, and the year following an election.
Context
of the Chart Below
YTY represents Year-To-Year (1 Year TSR Growth)
YTE represents Year-To-Election (Beginning of election year to election date)
YAE represents Year-After-Election (Beginning of the new year following an
election)
Example:
YTY = January 1, 1992 to 12/31/1992
YTE = January 1, 1992 to 11/3/1992
YAE = January 1, 1993 to 12/31/1993
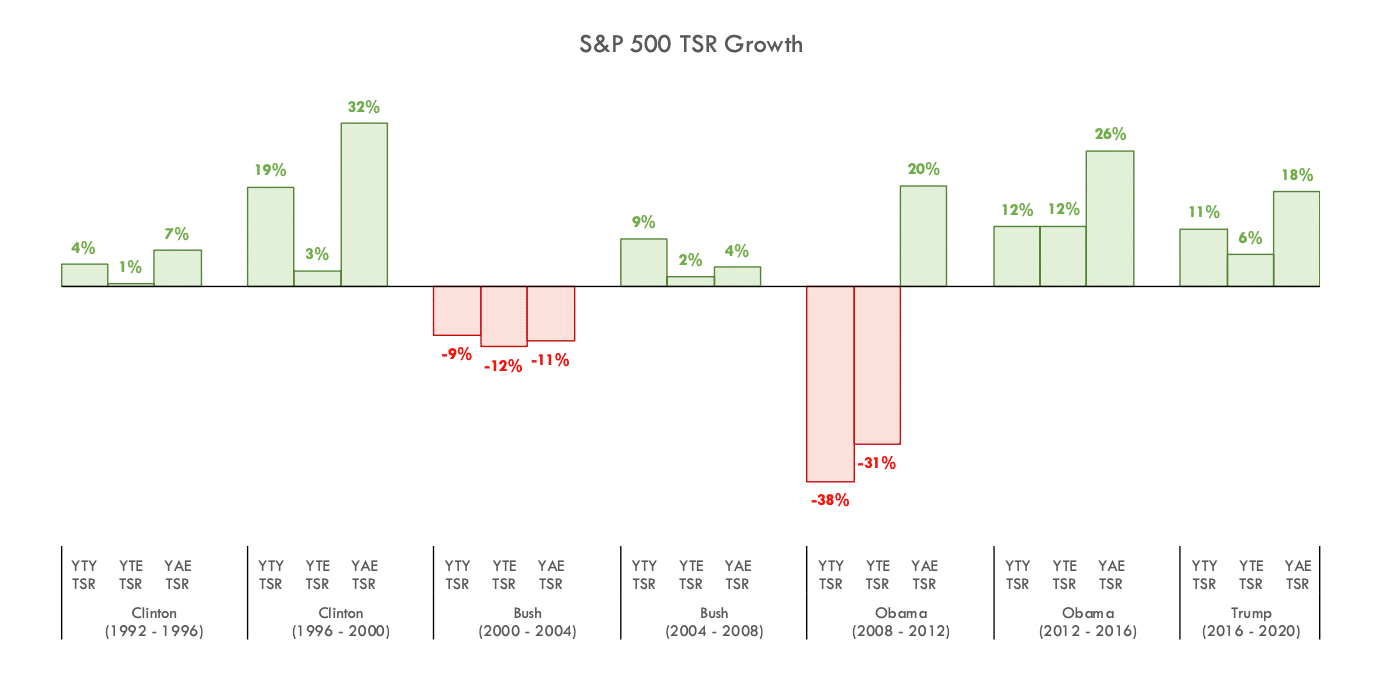
Viewing the TSR of the S&P 500 provides a visual snapshot of how the market has historically reacted leading up to an election, during an election, and after an election year to identify trends that may forecast probable or possible outcomes. While there have only been four presidents over the last twenty-eight years, due to re-election of the past three presidential candidates for a second term, the S&P 500 has seen steady growth overall for the better part of those years regardless which incumbent or party holds office. This consistent growth over the years should continue to promote a healthy economy for the foreseeable future.
NFPCC observed that the most distinct and identifiable area of concern is the period of a calendar year leading up to the election. However, shortly after the election, excluding Bush’s initial term in office, the S&P 500 TSR increased at a much higher rate. Specifically, while leading up to an election year the TSR growth for the S&P 500 has typically been slower than following an election year with 1%, 3%, 2%, 12%, 6% for 1992, 1996, 2004, 2012, and 2016 respectively. While this can be open to interpretation, it appears that the demand to spend has been stagnant due to the uncertainty of how the ensuing election plays out. This is typically in part due to the fear of the unknown, as companies and consumers might be reserving their capital to see what occurs during the election. This is a continuous trend and may very well happen again as we enter into Quarter 3 and Quarter 4 of 2020.
However, diving deeper paints a much clearer picture to the market sentiment. Shortly after electing a President the market becomes less conservative and starts accelerating upward. In the month following election, we can see how the market instantly reacts, with activity increasing by 3%, 16%, 3%, 7%, and 5% for 1992, 1996, 2000, 2004, and 2016 respectively. In the year following the election, the market ramps up even more with TSR growth being mostly double digit – 32%, 20%, 26%, and 18% for 1996, 2008, 2012, and 2016 elections respectively.
NFPCC understands how the uncertain political landscape can shape the commerce of the United States marketplace and the ensuing share values. As such, NFPCC finds it good practice to make sure your boards and committees are being responsible with the largest expense, their people and the associated payroll. Specifically, NFPCC has recommended to each organization we have consulted with, to ensure their respective programs are strategically positioned to drive effective decision-making. NFPCC believes this can be achieved through a thorough review of the annual and long-term incentive programs to confirm they are linked and work together to drive short-term goals that will act as the founding layer of long-term value creation.
Contact NFPCC for a review of your pay programs and take a proactive approach to compensation ahead of this year’s election.
